Mass Haul Diagram
Updated December 15, 2021
This article applies to:
- RoadEng Civil
- RoadEng Forestry
This Knowledge Base article is an excerpt from one of our tutorial files. The files referenced in the article, as well as the full tutorial document, are available in our Tutorial Installer.
-
 File | Open <RoadEngCivil>\Location\Align stage 3.dsnx.
 -
View | Retrieve Screen Layout <Defaults and Layouts>\training\training Profile Only.dlt. This will set up your screen to look like the figure below.
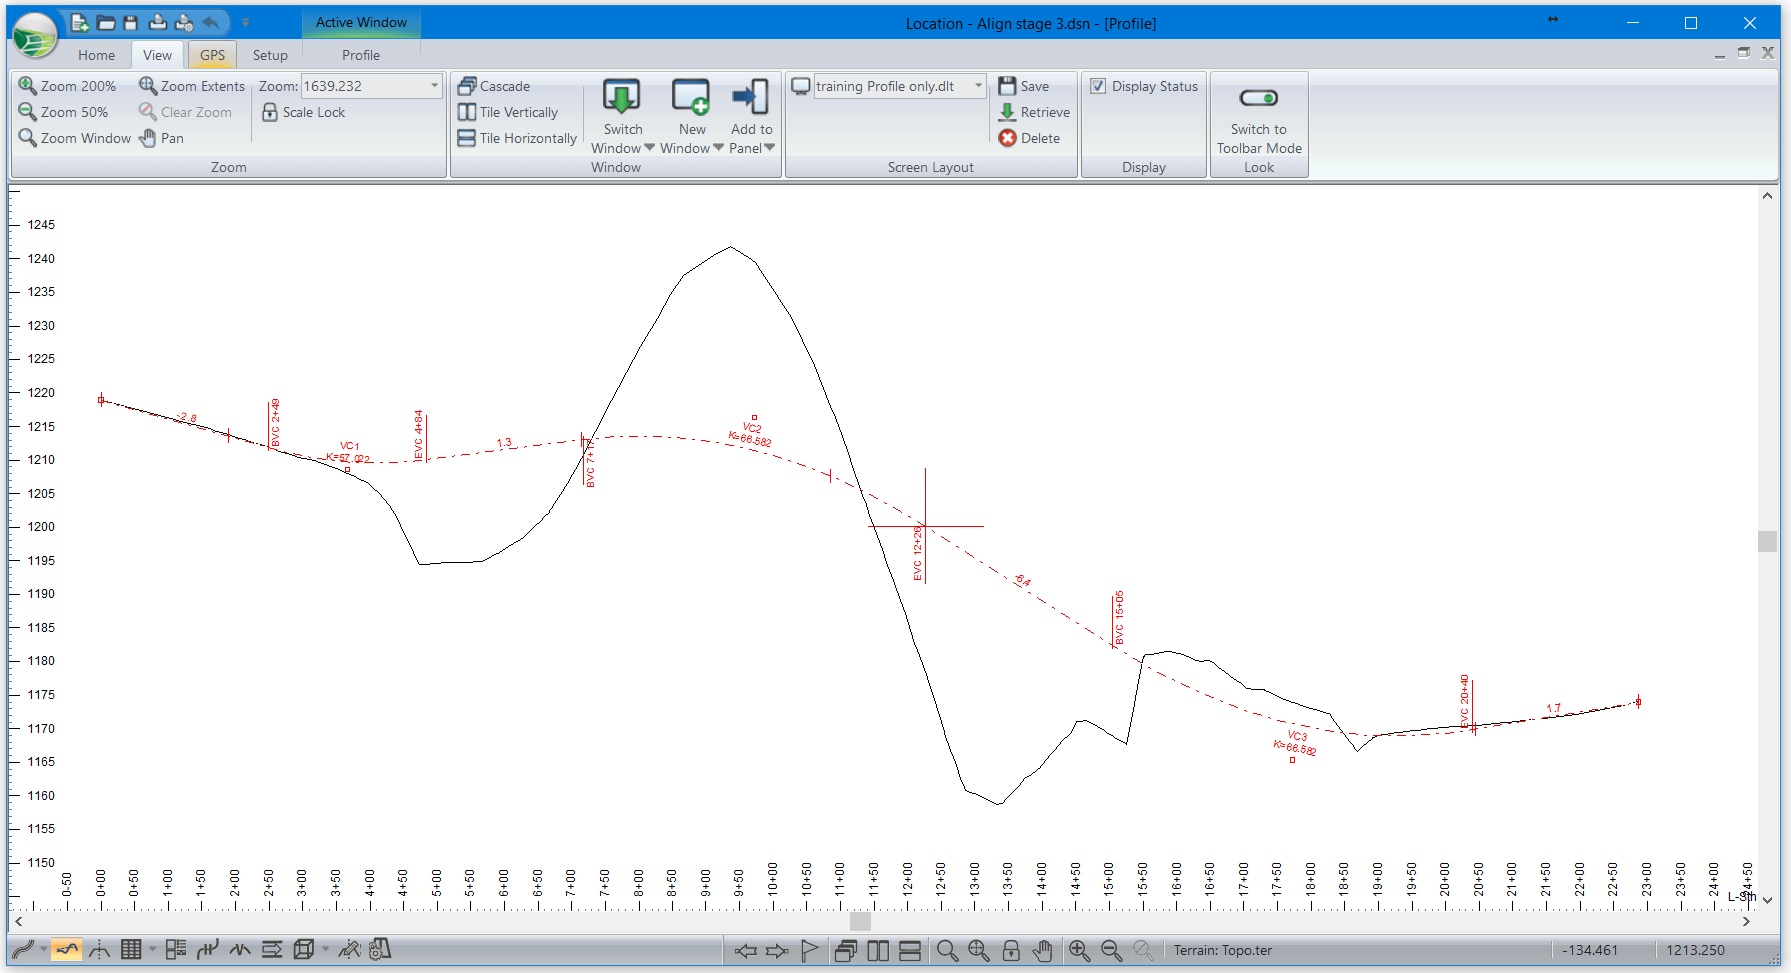
Figure 1: Location Design - training Profile Only.dlt Screen Layout
Displaying Cut and Fill Volumes in Data Table
-
Activate a new Data Window
 from the bottom navigation toolbar.
Change the columns displayed in the data window:
-
<Right-click> | Data Options…
-
Click the plus next to Point Types (Rows), this will open the Point Type Selection dialogue.
-
De-select any current selected point types (<double-click>).
-
<Double-click> on Auto interval points (xx.000 ft). If the interval is not currently set to 20.0 ft, press Properties… to configure. Adjust the Interval to 20.0 ft. Press OK to return to the previous dialogue.
-
Press OK.
-
In the Data Window Options main dialogue, press Columns…. Add the following fields as shown in the figure below:
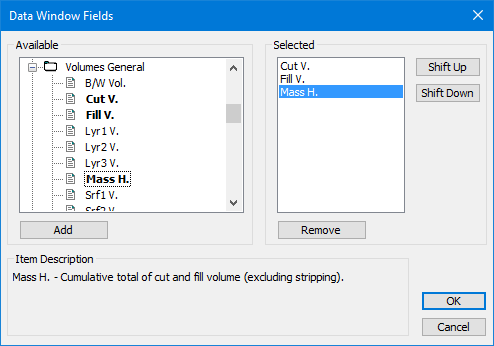
Figure 2: Configuring Data Window Fields
These are the subgrade volumes. Cut V. is the subgrade cut volume, Fill V. is the subgrade fill volume.
-
Press OK twice to return to the Data Window as shown below:
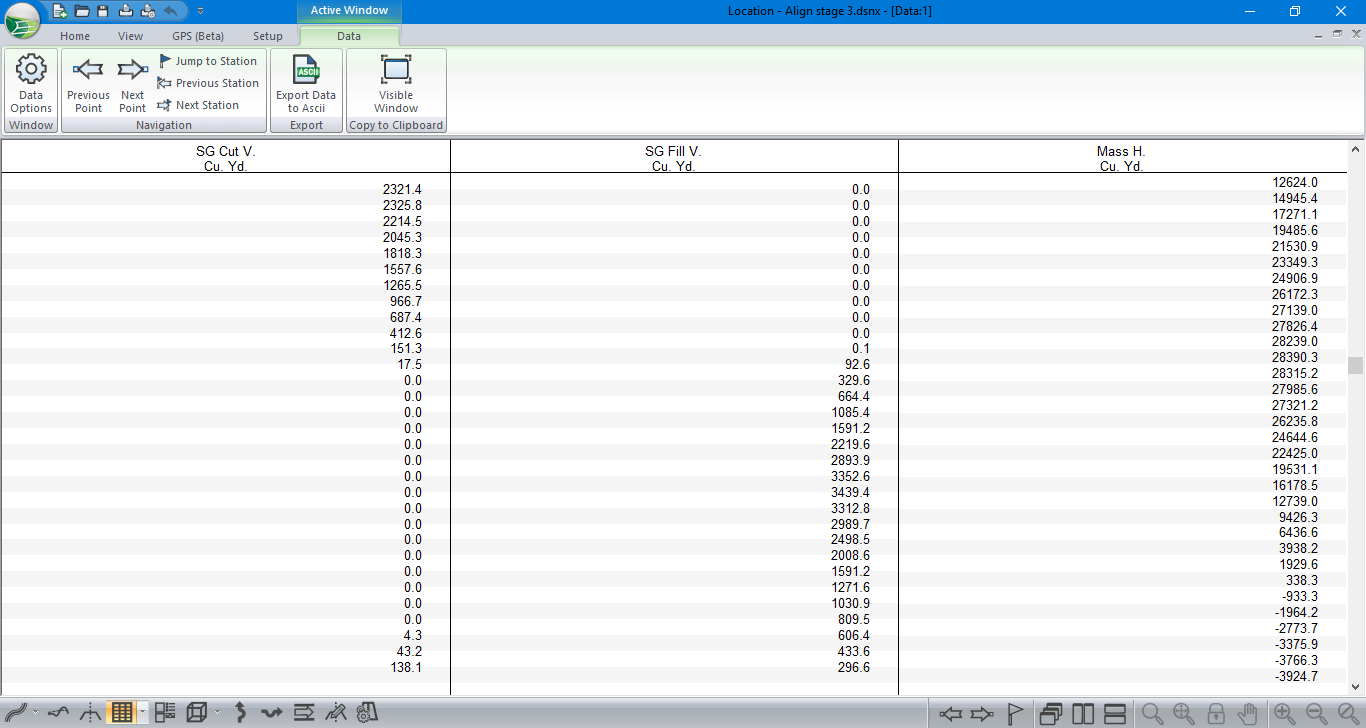
Figure 3: Data Window with Sub-grade Volumes
Note: Data Window details can be copied and pasted directly into an Excel spreadsheet. To do so, <right-click> | Copy Data to Clipboard, then open Excel and paste.
Displaying a Mass Haul Graph
The Mass Haul graph gives you quick, qualitative information about cut / fill volumes and movements. In this exercise, you will explore the options available for configuring this graphic.
Mass Haul is a graphic representation of accumulated volume; at any station, the value is the accumulated cut volume minus the accumulated fill volume up to that point. The difference in Mass Haul between two points indicates the volume of surplus (positive difference) or deficit (negative difference).
The default setting for mass haul includes only sub-grade material, however it is possible to select specific materials to be included.
-
Activate the Profile window from the bottom navigation toolbar.
-
<Right click> in the Profile window | select Profile Options… to open the dialogue box shown below left.
-
 Press Select… at the bottom of the Sub-Windows area. This will display the two-list dialogue box shown below on the right.
Figure 4: Profile Sub-Windows to Display
-
Select Mass Haul | Add button (or double click) to add it to the Selected list as shown above.
Note: The profile sub-windows area can display multiple items. All sub-windows will share the same horizontal axis (station) with the profile window.
-
Press OK button twice to accept changes and close the dialogue boxes.
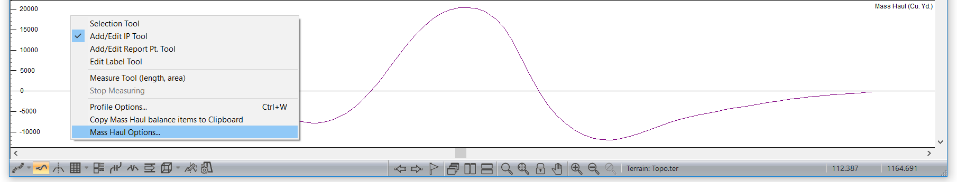
Figure 5: Mass-Haul Displayed in a Profile Sub-Window.
-
Move your mouse over the divider between the main profile window and the mass haul; when it changes to the sizing cursor
 , click and drag up to make more room for the mass haul.
 -
Right click in the mass haul window | select Mass Haul Options… to open the dialogue box shown in the figure below.
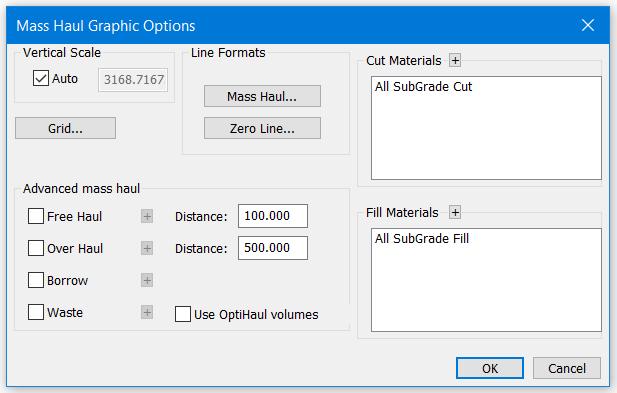
Figure 6: Mass Haul Graphic Options Dialogue Box
The concepts behind the mass haul diagram are discussed in detail in the help document. Type <F1> and read the help text if you are unfamiliar with terms such as Free Haul, Over Haul, Borrow and Waste. Close the help window when you are done.
-
Within Mass Haul Graph Options dialogue box, press the Grid… button to display the common grid and axis label control. Notice that the horizontal axis is disabled – it would be identical to the Profile axis and therefore redundant. Cancel button to close the grid options.
-
The Mass Haul… and Zero Line… buttons allow you to control the line style and color of the basic graphic items as shown in the Figure below.
Turn on all four Advanced mass haul items. This enables hatching.
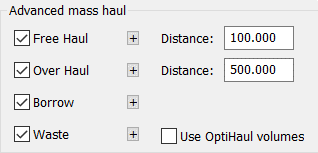
Figure 7: Advanced Mass Haul Items Enabled
The Free Haul Distance and Over Haul Distance are controlled by the fields on the right.
The plus button ![]() beside each item allows you to control the hatching style and color. The hatching in the figures below was chosen for black and white printing; you don’t need to change the current values.
beside each item allows you to control the hatching style and color. The hatching in the figures below was chosen for black and white printing; you don’t need to change the current values.
-
Press OK to accept changes and close the options dialogue box.
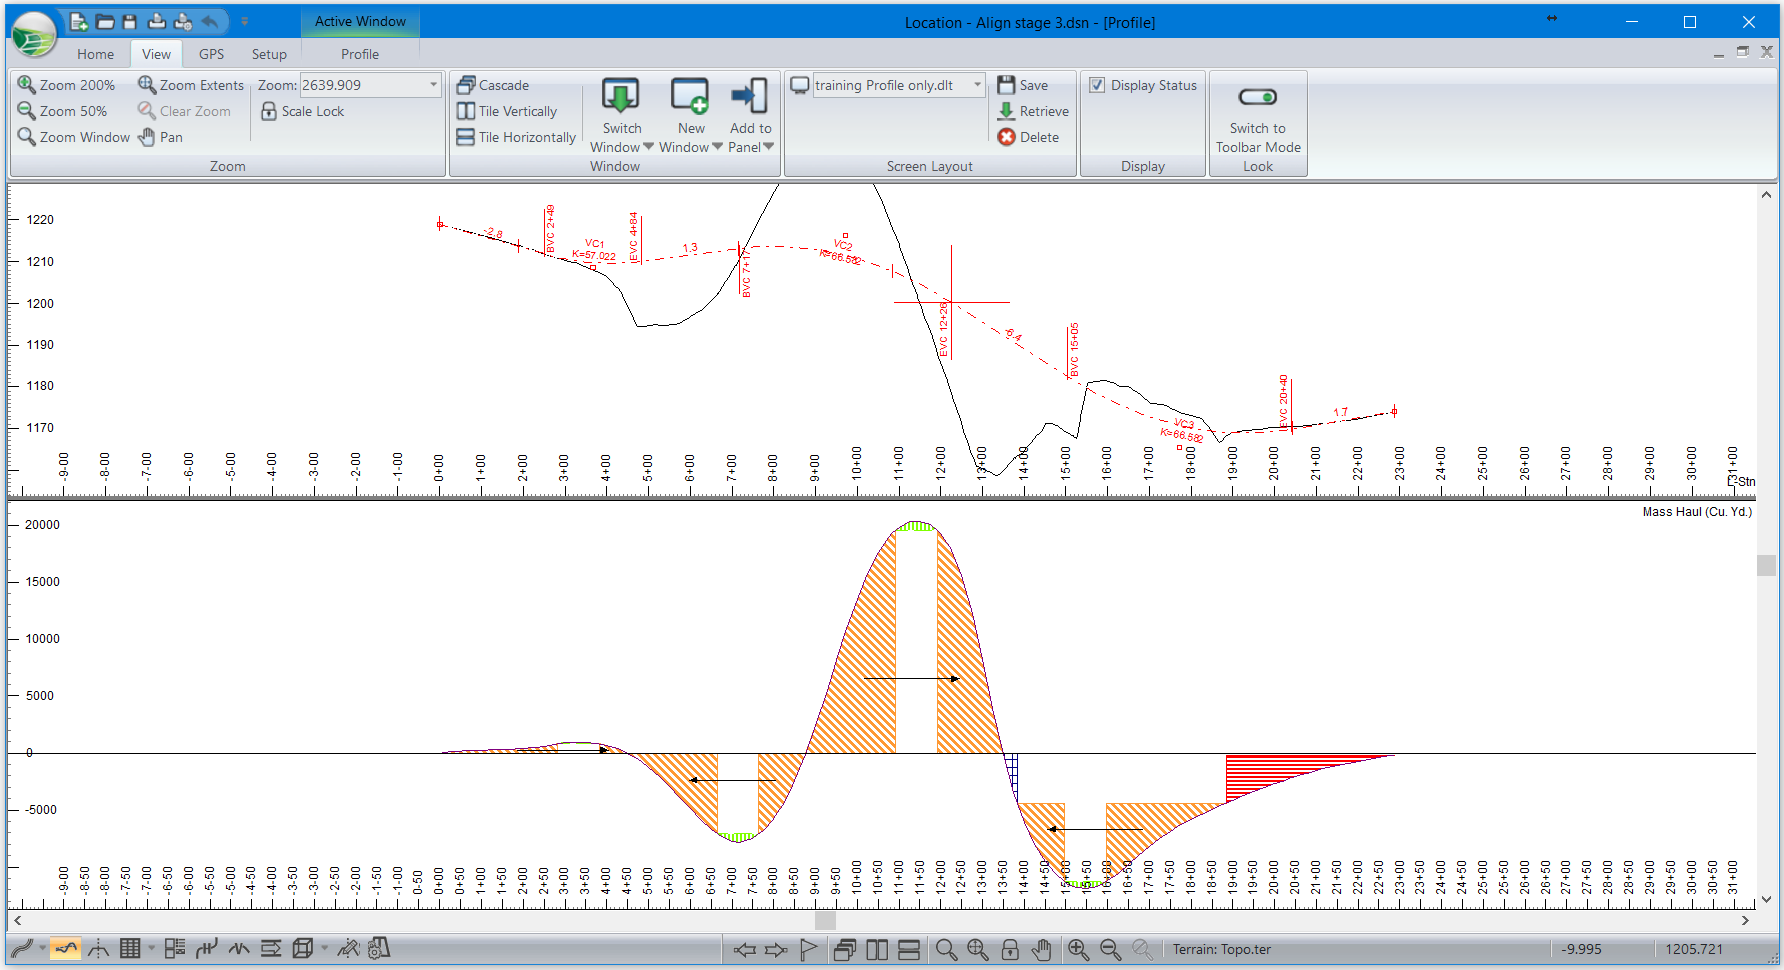
Figure 8: Mass Haul with Advanced Features Turned On
Note: That the hatch styles are different from the ones on your screen so that we can print this document in black and white.
| Free Haul | Material which is pushed or pulled a distance less than the Free Haul distance (100 ft.). | |
|---|---|---|
| Over Haul | Material moved beyond Free Haul Distance (100 ft.) and less than the Overhaul Distance (500 ft.). | |
| Borrow | Material which must be trucked in from outside the road project. | |
| Waste | Material which must be trucked outside the road project (End haul). |
It is possible to modify the mass haul to account for borrow and waste.
-
Add a new Borrow pit:Select menu Home | Assign by Range.
-
Select the Pits tab.
-
Add... | Access station: 450 | OK
-
Select Borrow and select the uncheck Variable volume (smart pit). Check Capacity (Cu. Yd.) box enter 8000.
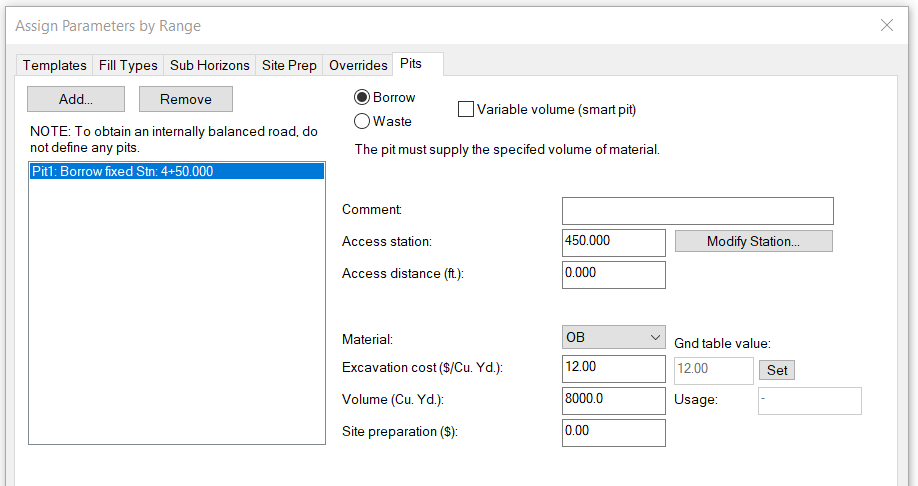
Figure 9: Assign Parameters by Range, Pits Tab
-
Press OK. Check both Update entire design and Re-Cost. Respond OK to the “Recalculate road alignment?” prompt.
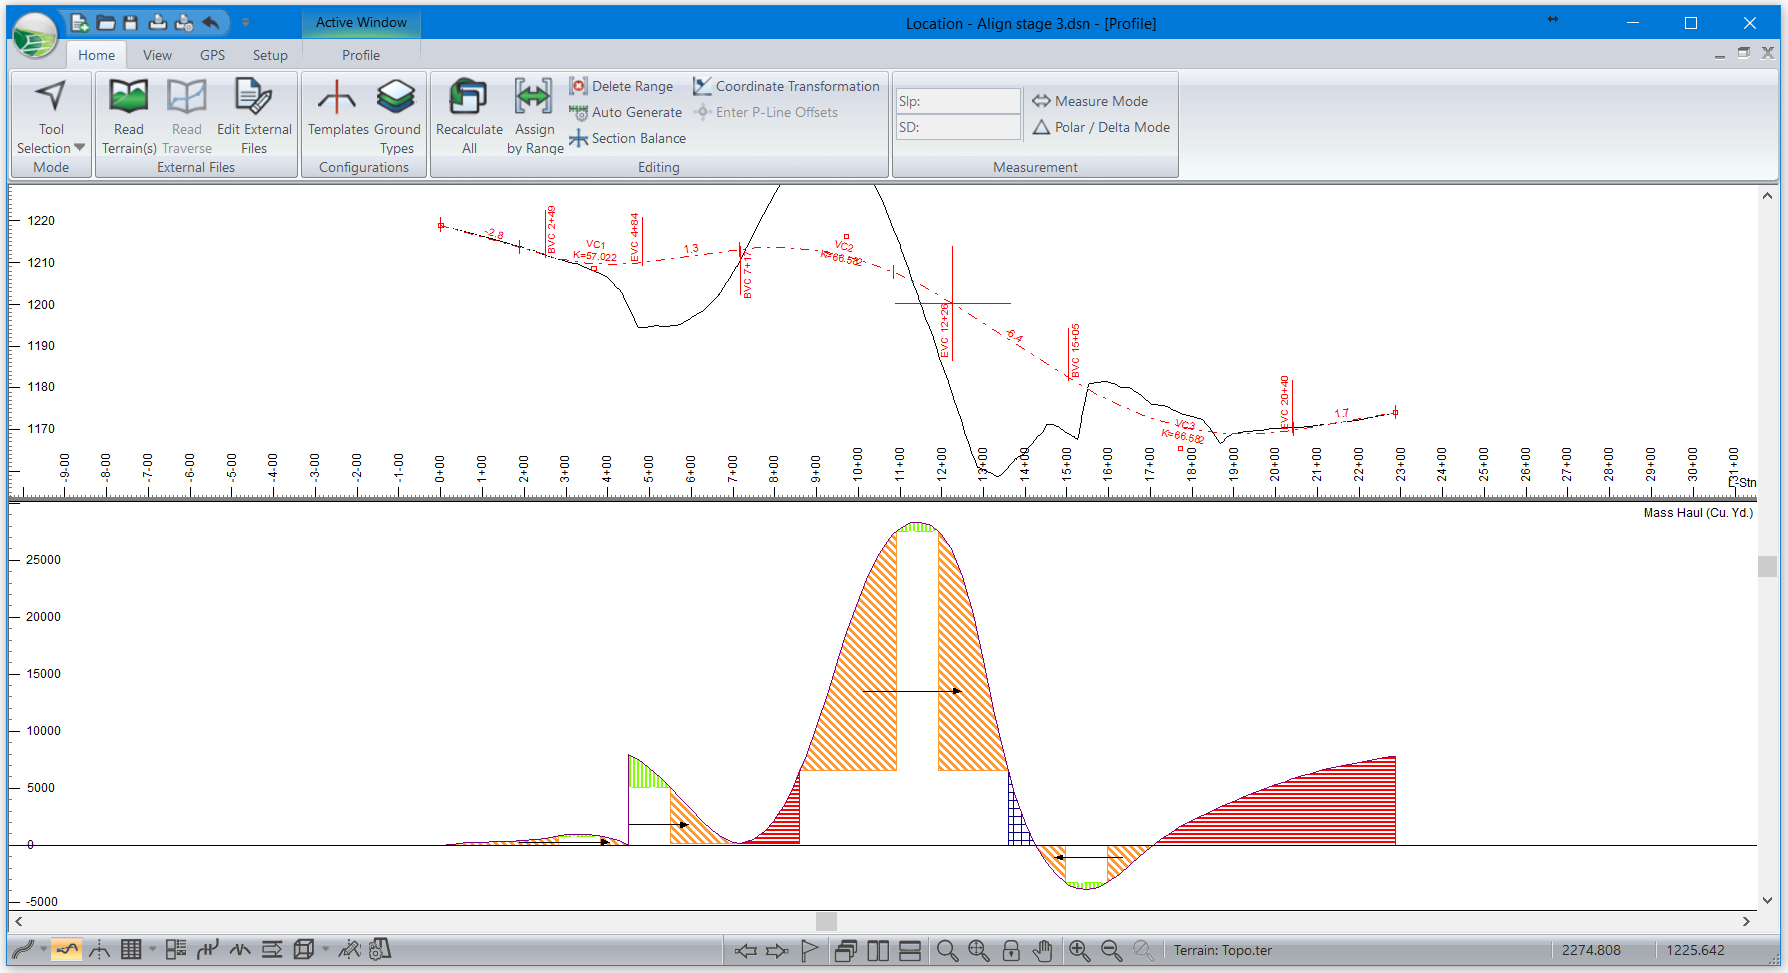
Figure 10: Mass Haul after 8000 Cubic Yards Borrowed at Station 4+50
Now there is no need to pull material back across the gully.
-
File | Close. Do not save changes.