Display and Reporting of Ditch Lines
Updated November 15, 2017
This article applies to:
- RoadEng Civil
- RoadEng Forestry
Reporting template point codes
In the exercise above we displayed the same point code labels in the section window. Point codes can also be displayed graphically in the Plan, Profile and Section windows. The Data and Status windows can display numeric information such as point code coordinates or centerline offsets.
The following steps will display the ditch lines in the Plan Window.
If you are not continuing from above, open <RoadEngCivil>\Location2\bluff_road.dsnx.
If you are continuing from above, restore the Section window so the Plan window is visible again.
Right click in the Plan window and select Plan Options...
Ensure that the Template Codes option is selected; press the
 button beside it to open the Codes dialogue box.
Notice that several point codes are already shown in the Code list. PT1 is the pavement edge, SB3 is the shoulder edge; L and R designate Left and Right.
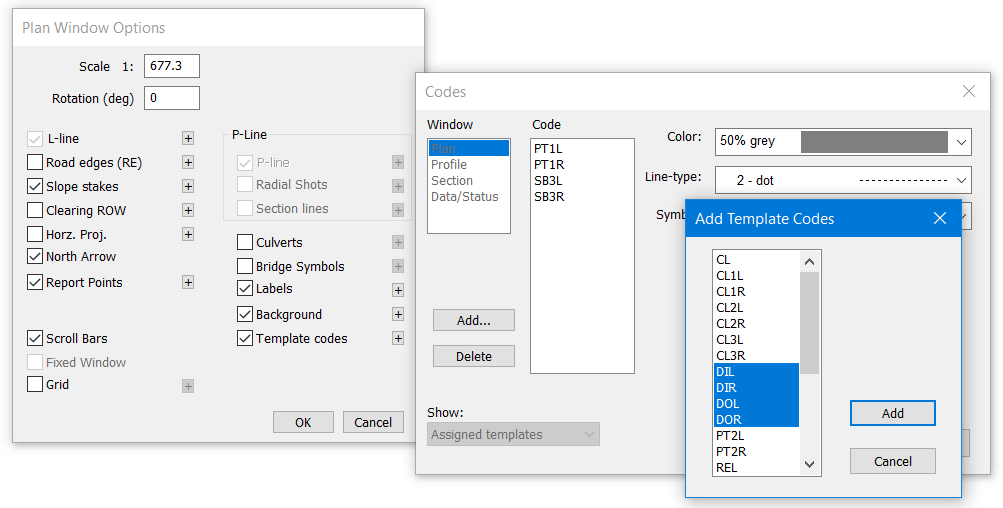
Figure 1: Adding Template Codes for Display in the Plan Window
Click the Add… button and select all the ditch point codes (figure above). Click Add to close the selection dialogue box.
With the new codes still selected, choose a blue dash line as shown below.
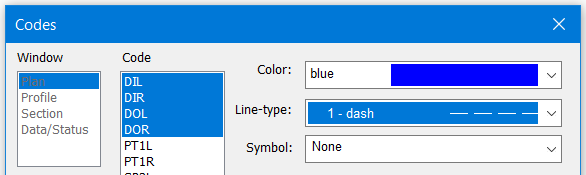
Figure 2: Plan Template Codes Format Control
Press OK to close the Codes dialogue box and respond OK to Recalculate Range.
Press OK again to close the Plan options. Adjust the Plan Window view so you can see the new ditch lines.
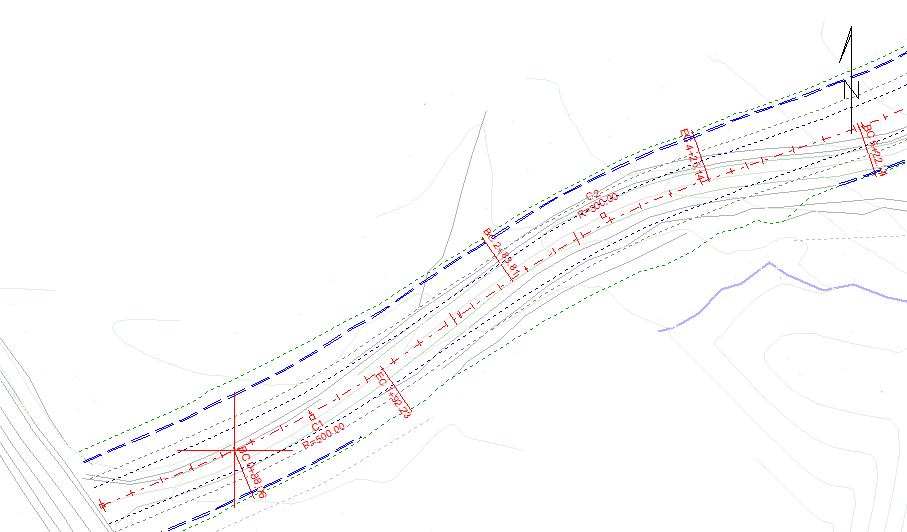
Figure 3: Ditch lines in Plan View
Note: Template point code display options we have changed in this exercise are saved in the Template Table.
Next, we will set up the data window. View | New Window | Data. Data | Data Options.
First set up the desired spacing of data rows.
-
Click the
 button next to Point Types to open the Point Type Selection dialogue box (Figure 20‑10 below left).
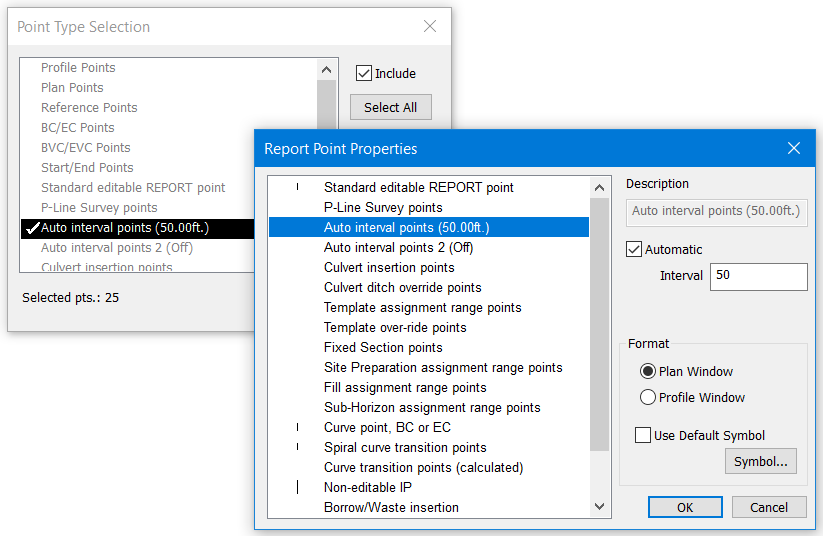
Figure 4: Setting the Data Window to Display Information every 50 ft
-
Ensure that only the Auto Interval points are checked for display (as in figure above left).
-
Press the Properties… button to show the Report Point Properties dialogue box (Figure 20‑10).
-
Select Auto interval points and check the Automatic box with an Interval of 50.
-
Press OK (there will be a re-calculation).
-
Press OK again to return to the Data Window Options dialogue box.
To set up desired columns to display: In Data Window Options Dialogue Box Press Columns… button to open the Data Window Fields dialogue (Figure 20‑11)
 Figure 20‑11: Selecting Point Code Offsets for Display in the Data Window.
Remove all but L-Stn Expand Template Codes and Add DIL, DIR, DOL, DOR Hoff and VOff for each of the available Template Codes (Figure 20‑11).
Press OK to exit the dialogue box Press OK again to close the Data Options dialogue and update the display (Figure 20‑12).
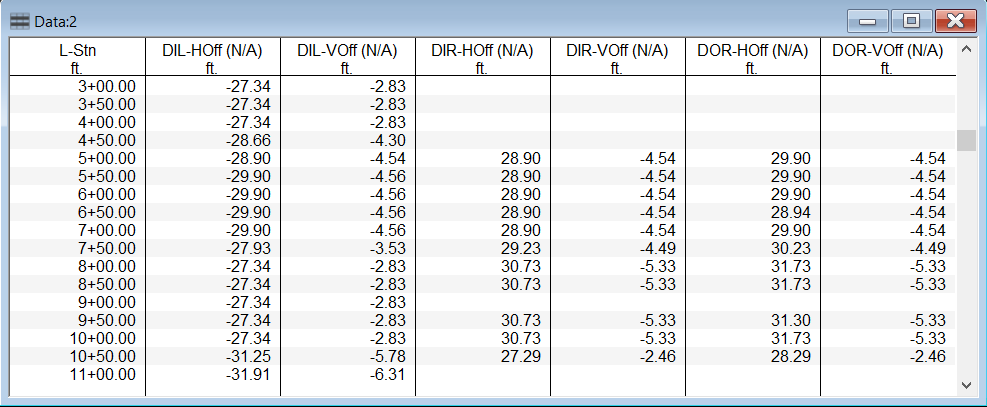
Figure 5: Data Window Showing Point Code Offsets
You can also add the point code offsets to your Section window Status area (below the graphic). Right click in the Section window and choose Section Options; press the Fields… button.
To export this data: Data | Export Data to ASCII. Data can be copied to clipboard: (Data | Visible Window or Right Click | Copy Data to Clipboard or use the hotkey <Ctrl+C>). This tabular data can be read by a spread sheet application.
This data can also be displayed at the base of the section window. You can add point codes to the base of the Section window Status area (below the graphic): Right click in the Section window | Section Options… | Fields… | Select the information you would like to add or remove | OK | OK.
 File | Close. Do not save changes.